





















CE Marking Under EU MDR: What Medical Device Buyers Should Verify
September 2026 Disposable Glove Market Review: Global Trade and China Exports
FROM: INTCO Medical|07 Nov 2026
Disposable glove data published for September 2026 covers several reporting periods. Reported imports under HS Code 401512 totaled US$25.92 billion in January–June, down 2.9% year over year. U.S. imports of nitrile and latex gloves reached 69.18 billion pieces in January–July, up 9.4%. China’s customs data through August records year-to-date export growth in PVC gloves, medical-use gloves under HS Code 40151200, and gloves under HS Code 40151900.
This market review examines global demand, export markets, and China's category-level glove shipments. The analysis follows the reporting periods and product classifications specified by the relevant trade statistics.
September 2026 Overview
Key figures: Reported imports under HS Code 401512 were US$25.92 billion for January–June 2026, down 2.9% year over year. U.S. nitrile and latex glove imports reached 69.18 billion pieces for January–July, up 9.4%. China’s January–August exports reached 66.77 billion PVC gloves, 57.17 billion pieces of medical-use gloves under HS Code 40151200, and 23.96 billion pieces of gloves under HS Code 40151900.
The following figures cover different reporting periods, reflecting the latest available trade statistics for each market and product category.
Indicator | Reporting period | Result |
Reported imports under HS Code 401512 | January–June 2026 | US$25.92 billion; -2.9% YoY |
U.S. nitrile and latex glove imports | January–July 2026 | 69.18 billion pieces; +9.4% YoY |
China PVC glove exports | January–August 2026 | 66.77 billion pieces; +13.8% YoY |
China exports of medical-use gloves under HS Code 40151200 | January–August 2026 | 57.17 billion pieces; +7.6% YoY |
China exports of gloves under HS Code 40151900 | January–August 2026 | 23.96 billion pieces; +9.5% YoY |
The September 2026 data combines series with different release schedules. Global import figures cover the first half of the year, U.S. import figures run through July, and China Customs export figures run through August.
Global Import Trends under HS Code 401512
According to International Trade Centre (ITC) trade statistics compiled under HS code 401512, the reported import value reached US$25.92 billion from January to June 2026, compared with US$26.68 billion during the same period in 2025, representing a year-over-year decline of 2.9%. The top 10 importing countries accounted for 70% of reported import value.
The United States remained the largest import market, although its import value declined year over year. Brazil, Japan, and the Netherlands recorded increases. Germany, the United Kingdom, Türkiye, and Poland recorded declines.
Supplier export values also varied by country. During January–June 2026, Malaysia, China, and Thailand all recorded year-over-year growth in reported glove export value. China posted the strongest increase among these three markets. Indonesia’s export value declined, while Vietnam recorded a small increase.
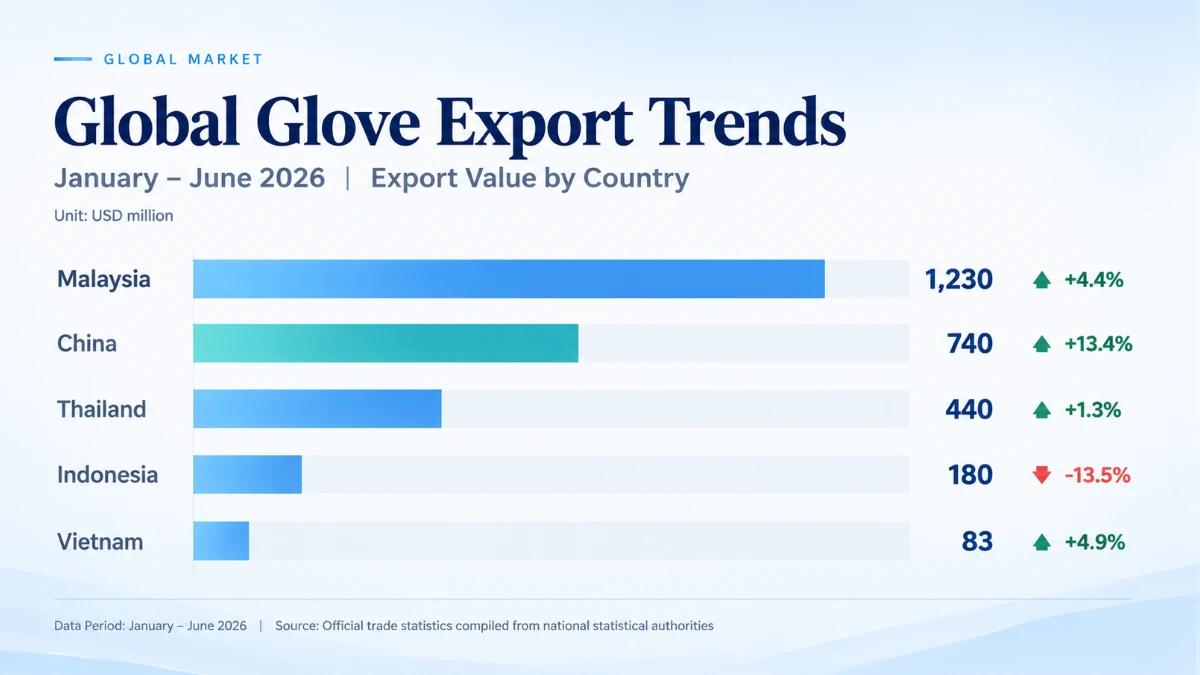
Glove export values by country, January–June 2026 (USD million). Source: Official national trade statistics.
The 2023–2025 comparison shows different export value trends across major producing countries. Changes in export values were accompanied by differences in market pricing, production capacity, and shipment volumes.
Export Destinations Varied by Production Country
The January–June destination mix shows different regional concentrations across the main glove-producing countries:
Exporting country | Largest destination region | Share |
China | Europe | 66.9% |
Malaysia | North America | 51.9% |
Thailand | North America | 43.3% |
Indonesia | North America | 76.5% |
Vietnam | North America | 85.2% |
China’s export structure centered on Europe. Malaysia and Thailand maintained broader regional coverage with North America as their largest destination. Indonesia and Vietnam recorded higher exposure to the North American market.
These shares provide procurement teams with a country-level view of destination exposure when assessing sourcing origins and regional supply coverage.
U.S. Glove Imports and Supplier Mix
According to U.S. International Trade Commission (USITC) trade statistics, U.S. imports of nitrile and latex gloves totaled 69.18 billion pieces from January through July 2026, up 9.4% year over year.
U.S. glove imports reached 145.78 billion pieces in 2021, before declining to 100.49 billion in 2022 and 83.21 billion in 2023. Imports subsequently recovered to 104.75 billion pieces in 2024 and 108.97 billion pieces in 2025.
U.S. Import Structure by Country
Origin | January–July 2026 share |
Malaysia | 56.4% |
Thailand | 16.4% |
Vietnam | 13.4% |
Indonesia | 8.3% |
China | 2.4% |
Other origins | 3.1% |
Malaysia supplied more than half of reported U.S. nitrile and latex glove imports. Thailand, Vietnam, and Indonesia together represented 38.1% of the market.
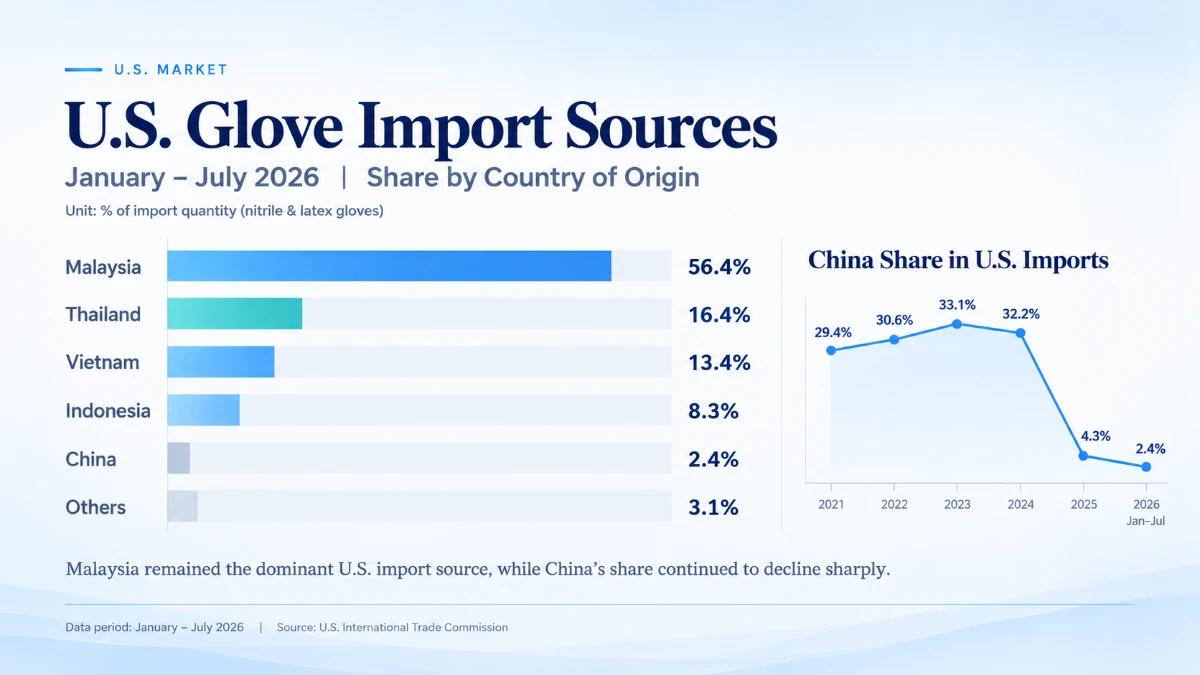
U.S. nitrile and latex glove import shares by country of origin, January–July 2026. Source: U.S. International Trade Commission.
The U.S. import mix provides a reference for understanding supplier-origin distribution. Importers should also evaluate product specifications, applicable tariffs, delivery lead times, regulatory documentation, and supplier reliability when planning procurement.
China Glove Export Data Through August
China Customs data through August 2026 shows year-over-year growth across all three reported glove categories. However, their monthly export performance in August varied by product category.
Category | August exports | August YoY | January–August exports | January–August YoY |
PVC gloves | 8.65 billion pieces | +2.7% | 66.77 billion pieces | +13.8% |
Medical-use gloves under HS Code 40151200 | 7.42 billion pieces | +5.1% | 57.17 billion pieces | +7.6% |
Gloves under HS Code 40151900 | 2.97 billion pieces | -2.6% | 23.96 billion pieces | +9.5% |
The reported export categories correspond to China Customs codes 39262011 for PVC gloves, 40151200 for medical-use gloves, and 40151900 for the related glove category. Product descriptions follow the classifications used in the underlying customs data.
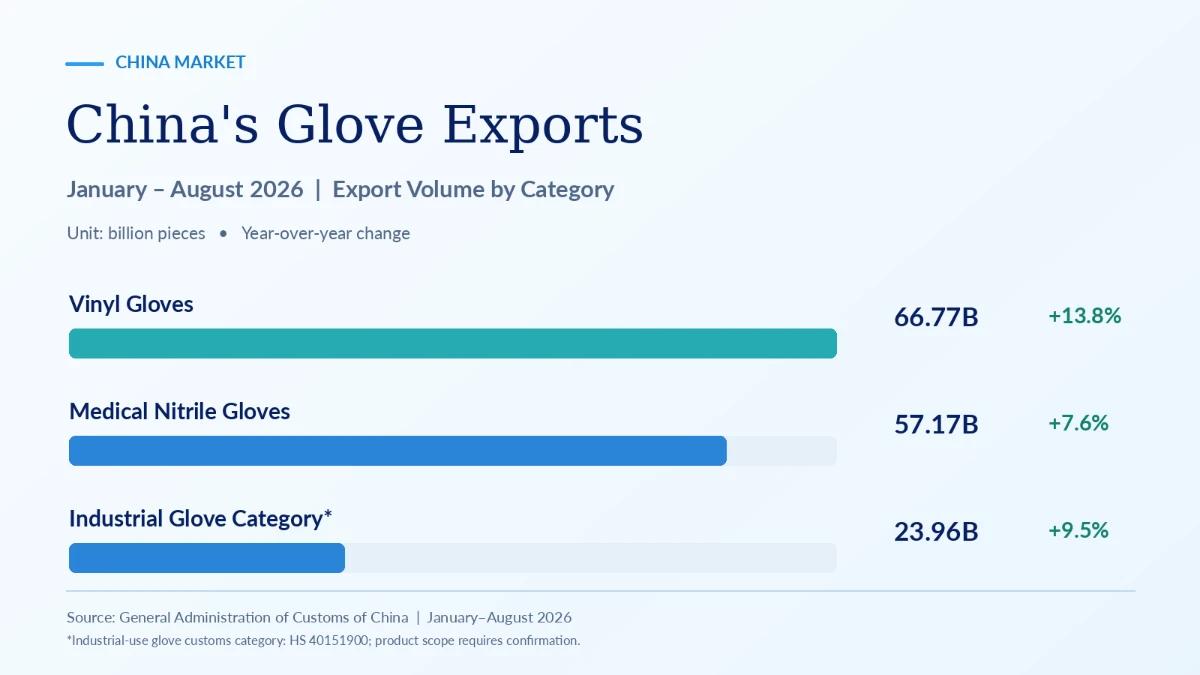
Note: Product labels in this chart follow the original source presentation. In the article, customs categories are described using their corresponding codes: HS 40151200 for medical-use gloves and HS 40151900 for the related glove category. Product scope follows the applicable customs classification.
PVC Glove Exports Reached 66.77 Billion Pieces
China exported 8.65 billion PVC gloves in August, down 1.37% month over month and up 2.7% year over year. January–August volume reached 66.77 billion pieces, representing year-over-year growth of 13.8%.
North America accounted for 45.7% of China’s August PVC glove exports. Asia excluding Japan and South Korea represented 19.7%, Japan and South Korea 15.7%, and Europe 12.2%.
Region | July 2026 | August 2026 |
North America | 43.8% | 45.7% |
Europe | 13.1% | 12.2% |
Japan and South Korea | 20.6% | 15.7% |
Other Asian markets | 16.9% | 19.7% |
South America | 2.3% | 2.7% |
Oceania | 2.7% | 2.9% |
Africa | 0.7% | 1.0% |
The United States remained the largest destination. China exported 27.207 billion PVC gloves to the country during January–August 2026, compared with 24.884 billion pieces in the same period of 2025.
Japan ranked second at 12.289 billion pieces. France recorded year-over-year growth of 44.4%, the United Arab Emirates 39.7%, and Russia 31.5%.
Trade statistics also show China’s average PVC glove export price rising through June before easing in July and August. The August average remained above the corresponding 2025 level.
Europe Accounted for 63.6% of Medical-use Glove Exports under HS Code 40151200
China exported 7.42 billion pieces of medical-use gloves under HS Code 40151200 in August, up 6.5% month over month and 5.1% year over year. January–August exports reached 57.17 billion pieces, up 7.6% from the comparable 2025 period.
Europe accounted for 63.6% of August exports. North America represented 13.0%, South America 7.6%, other Asian markets 7.0%, Oceania 4.0%, Japan and South Korea 3.3%, and Africa 1.5%.
Region | July 2026 | August 2026 |
Europe | 71.3% | 63.6% |
North America | 8.1% | 13.0% |
Other Asian markets | 5.0% | 7.0% |
South America | 5.4% | 7.6% |
Oceania | 3.5% | 4.0% |
Japan and South Korea | 5.4% | 3.3% |
Africa | 1.3% | 1.5% |
Germany ranked first among the reported destination markets for China’s medical-use gloves under HS Code 40151200, receiving 7.79 billion pieces during January–August 2026. The United Kingdom followed with 6.24 billion pieces.
Exports to the United States declined 30.9% year over year. Japan recorded growth of 52.7%, the United Kingdom 40.7%, the Netherlands 30.2%, Russia 25.1%, and Spain 21.4%.
The 10 largest destination countries accounted for 66.4% of China’s exports of medical-use gloves under HS Code 40151200.
Exports of Gloves under HS Code 40151900 Eased in August
China exported 2.97 billion pieces under HS Code 40151900 in August 2026, down 8.9% from July and 2.6% from August 2025. January–August exports totaled 23.96 billion pieces, up 9.5% year over year.
August destination shares were distributed among Europe at 27.2%, North America at 23.7%, Japan and South Korea at 22.7%, and other Asian markets at 14.4%.
Region | July 2026 | August 2026 |
Europe | 23.3% | 27.2% |
North America | 20.8% | 23.7% |
Japan and South Korea | 26.8% | 22.7% |
Other Asian markets | 14.0% | 14.4% |
South America | 9.9% | 8.9% |
Oceania | 4.0% | 1.9% |
Africa | 1.2% | 1.1% |
Japan ranked first among the reported destination markets for gloves under HS Code 40151900. China exported 5.28 billion pieces to Japan during January–August 2026, representing year-over-year growth of 73.2%.
Exports to the Netherlands increased 107.3%, Spain 60.3%, and the United Kingdom 42.7%. Shipments to the United States declined 10.6%.
China’s reported nitrile glove export unit value reached US$25.02 per box in July 2026, following an upward trend during the first half of the year.
Procurement Considerations
Procurement teams can use this market review as a dated input for category and origin planning.
Define the glove category. Identify PVC, medical nitrile, industrial nitrile, latex, synthetic latex, or PE glove requirements.
Confirm the specification. Document size range, thickness, color, cuff design, surface texture, powder status, intended use, packaging, and destination-market requirements.
Record the reporting period. Mark whether the benchmark covers January–June, January–July, or January–August.
Review destination and origin exposure. Compare regional export shares with the sourcing countries and customer markets in the purchasing plan.
Verify supply terms. Confirm capacity availability, minimum order quantity, lead time, packaging configuration, quality records, lot traceability, and change-control procedures.
This checklist connects industry indicators with an actual purchase specification. This market review does not provide supplier-level production figures, current quotations, or market forecasts.
INTCO Medical Glove Portfolio
INTCO Medical and the company’s dedicated INTCO Gloves website present disposable glove products for healthcare, dental, laboratory, food processing, cleaning, beauty, tattoo, and industrial applications.
The official portfolio includes:
- Nitrile gloves
- Latex gloves
- Synthetic latex gloves
- Vinyl gloves
- Synmax vinyl gloves
- PE gloves
- Household and work-safety gloves
INTCO Medical has an annual disposable glove production capacity of 107 billion pieces, including 74 billion nitrile gloves and 33 billion vinyl gloves, and serves customers across more than 150 countries and regions. For more details about the company’s glove manufacturing capabilities, visit the Global Production & Supply Network.
Buyers can use the product pages to identify relevant glove categories and request current specifications, samples, certificates, packaging details, order quantities, lead times, and commercial terms directly from INTCO Medical.
FAQ
What was the reported global import value under HS Code 401512 in the first half of 2026?
Trade statistics record reported imports under HS Code 401512 of US$25.92 billion from January through June 2026, down 2.9% from the corresponding 2025 period. The series cites the International Trade Centre. The United States remained the largest import market, while the top 10 countries represented 70% of reported import value.
How many gloves did China export in August 2026?
China exported 8.65 billion PVC gloves, 7.42 billion pieces of medical-use gloves under HS Code 40151200, and 2.97 billion pieces under HS Code 40151900 in August 2026. January–August totals reached 66.77 billion, 57.17 billion, and 23.96 billion pieces, respectively. Each figure uses the customs code listed for that category in the underlying customs data.
Did U.S. imports of nitrile and latex gloves grow in 2026?
U.S. International Trade Commission trade statistics show 69.18 billion pieces of combined nitrile and latex glove imports from January through July 2026, up 9.4% year over year. Malaysia represented 56.4% of the reported origin mix, followed by Thailand at 16.4% and Vietnam at 13.4%.
Which region purchased the largest share of China’s medical-use gloves under HS Code 40151200?
Europe represented 63.6% of China’s exports of medical-use gloves under HS Code 40151200 in August 2026. North America accounted for 13.0%, South America 7.6%, and other Asian markets 7.0%. Germany ranked first among destination countries for the January–August period.
What should glove buyers verify when using a market review?
Buyers should record the product category, customs code, reporting period, unit, destination market, and source agency for each figure. They can then compare the market data with current supplier quotations, product specifications, quality documents, lead times, and contract terms.
Conclusion
The September 2026 disposable glove market review brings together global trade data through June, U.S. glove import statistics through July, and China glove export data through August.
China’s January–August exports increased across PVC gloves, medical-use gloves under HS Code 40151200, and gloves under HS Code 40151900. Regional demand patterns differed by category: North America accounted for the largest share of PVC glove exports, Europe led medical-use gloves under HS Code 40151200, and exports of gloves under HS Code 40151900 were distributed across Europe, North America, Japan, South Korea, and other Asian markets.
Medical distributors, importers, and procurement teams can apply these figures by product category, destination, unit, and reporting period. Buyers reviewing disposable glove options can visit INTCO Medical’s official product pages and submit their specifications, volumes, packaging requirements, and destination-market documentation needs.